
Engagement versus impact
From the beginning we have been careful that MAIA's north star is the financial results of our businesses, not engagement. That caution comes from the research. In the largest field experiment on AI business mentorship to date, Otis and coauthors gave Kenyan entrepreneurs a GPT-4 business mentor on WhatsApp, and who benefited had little to do with how much people used it: high and low performers engaged with the mentor at similar rates and asked similar kinds of questions, and the gap came from which advice they actually implemented. We see the same pattern in our own data, where overall engagement is not much related to who reports better business outcomes. So we have never set out to maximize engagement, and we get suspicious when an AI product reports engagement as if it were impact.
That said, engagement is still a genuinely useful metric for A/B testing, because it is quick and easy to observe: every user generates it within weeks, while impact surveys take months and only come from the users who answer them. And surely some minimum level of engagement is necessary for any impact at all, since MAIA cannot help a business it never talks to. So where is the floor? After nearly half a million messages from MAIA users, we can dig into this relationship in more detail.
We took every user who answered our day-60 impact survey (have your sales gone up since you started: no, a little, or a lot), 461 businesses after our standard data cleaning, and measured their engagement over those first 60 days as active weeks: the number of weeks in which the user sent MAIA at least one message.
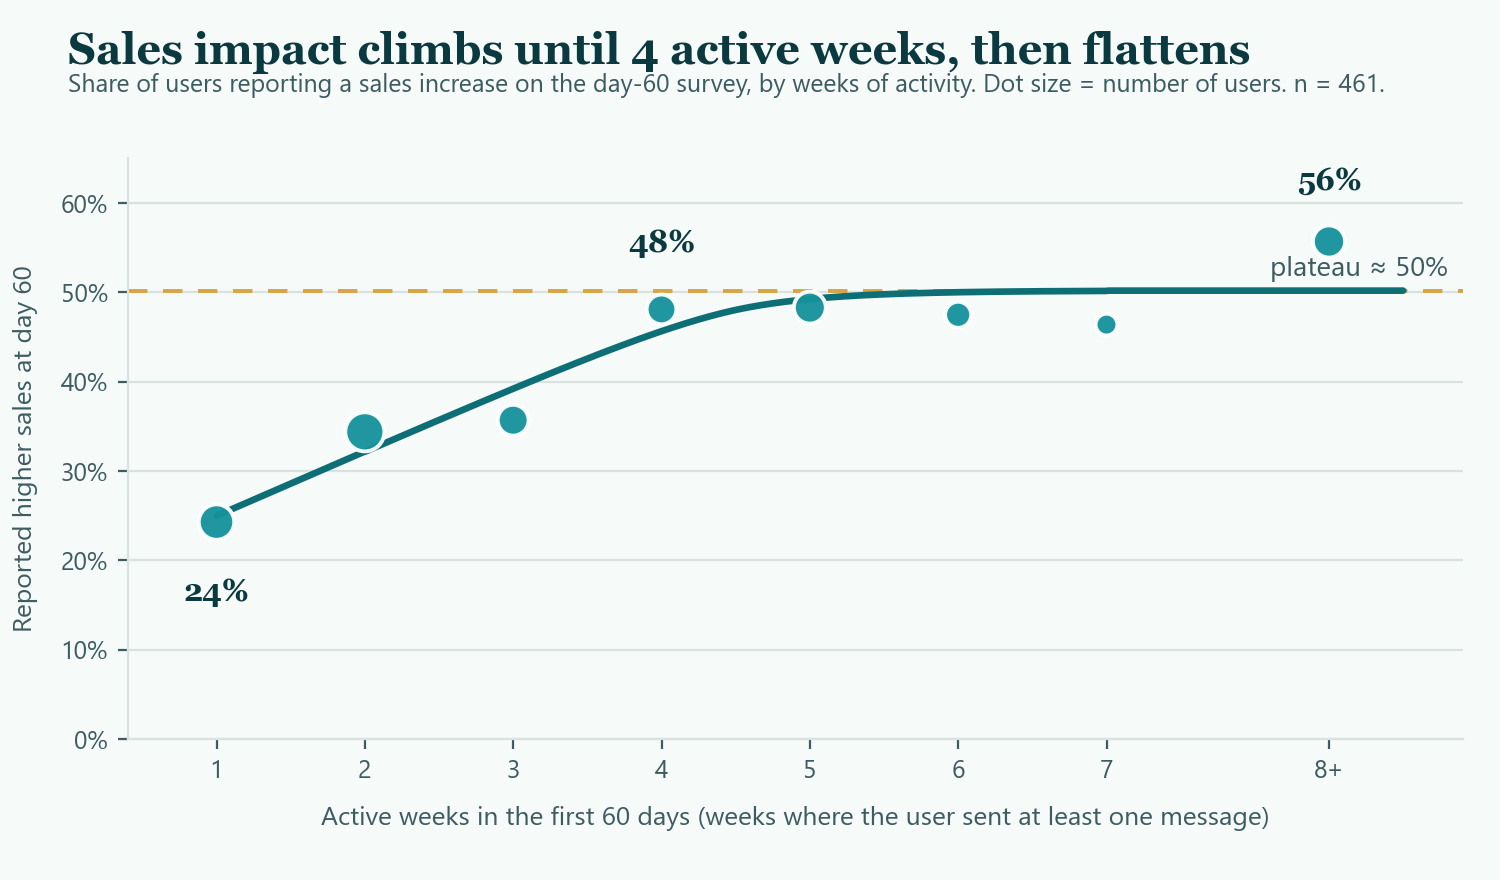
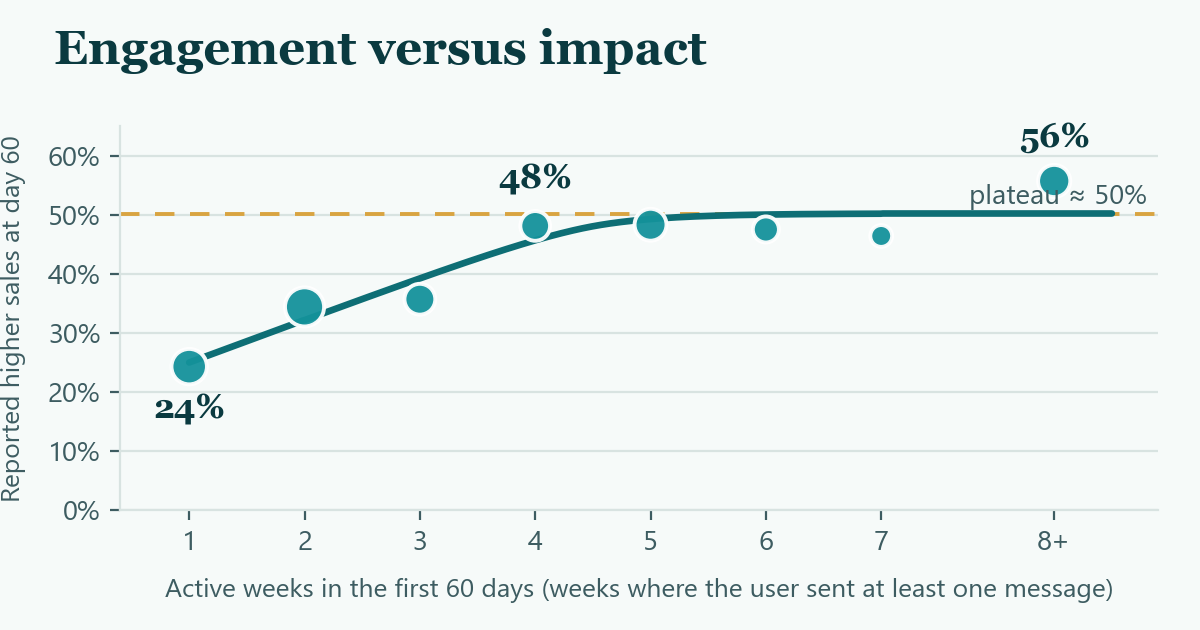
The result is quite intuitive. Users who never came back after their onboarding week report higher sales 24% of the time. Each additional active week adds roughly 7 percentage points, up to about 4 active weeks, and after that the curve goes flat at around 50%. In other words, using an AI mentor every single week is no better than using it every other week, but there is a real minimum dose: below it, impact rates fall by half.
It is also active weeks that carries the relationship, not the raw number of messages. Message counts mix together the depth of one particular conversation with ongoing engagement with the mentor, and when we separate the two, the rhythm wins. Users who sent a lot of messages packed into fewer than 4 active weeks reported higher sales just 27% of the time, no better than the least engaged group, while the same message volume spread across 4 or more weeks came in at 53%. The pattern holds within each of our countries separately, so it is not an artifact of pooling. One honest caveat: this is a correlation, not an experiment, and causality surely runs both ways, since a user whose sales are improving has a good reason to keep talking to their mentor. Our cost-savings survey, by the way, shows no engagement relationship at all, which fits what we found when we looked at defensive versus offensive wins earlier this year: cost wins usually come from a single high-stakes moment, like talking a farmer out of a bad equipment purchase, while sales growth comes from trying new things and following through on them over time.
The practical implication is for our A/B testing. When we test changes to onboarding or message content, engagement remains a fine intermediate target, but this curve says the right metric is a threshold, not an average: the share of users who reach 4 or more active weeks in their first two months. Moving an already-engaged user from 5 active weeks to 8 is worth nothing measurable, and moving a user from 1 active week to 4 is where all the impact lives. An average of messages or active weeks goes up in both cases, so it cannot tell the difference between the change that matters and the one that does not. So P(4+ active weeks) it is.